
- 162
- 1 876 905
TileStats
Sweden
Приєднався 24 січ 2021
Hi
My name is Andreas Tilevik. With this channel, I thought that I could share my video lectures from my courses in statistics and systems biology at the University of Skövde, Sweden. Note that the target group is mainly with a non-mathematical background. The videos will be published in a logical order at:
www.tilestats.com
How to compute a p value and extract a critical value in R
www.tilestats.com
1. Compute a p-value from a t-distribution (2:14)
2. Extract a critical value from a t-distribution (04:36)
3. How to plot the t-distribution (07:09)
4. The standard normal distribution (08:30)
5. The f-distribution (09:10)
6. The chi-square distribution (09:58)
1. Compute a p-value from a t-distribution (2:14)
2. Extract a critical value from a t-distribution (04:36)
3. How to plot the t-distribution (07:09)
4. The standard normal distribution (08:30)
5. The f-distribution (09:10)
6. The chi-square distribution (09:58)
Переглядів: 338
Відео


Multinomial logistic regression | softmax regression | explained
Переглядів 764Місяць тому
For more videos in a logical order, go to: www.tilestats.com 1. Binary logistic regression 2. One vs all logistic regression (03:00) 3. The softmax function (06:40) 4. Multinomial logistic regression (07:40) 5. Multinomial logistic regression in R and SPSS (11:40) 6. Multinomial logistic regression vs ANN (13:30)

Why we divide by n-1 when calculating the sample variance - the proof | unbiased estimator
Переглядів 1,2 тис.Місяць тому
www.tilestats.com 1. The sample variance (1:00) 2. Sample variance vs population variance (02:40) 3. Unbiased vs biased estimator (03:45) 4. The mathematical proof (05:30) 5. The expectation rules (12:30)

Expected value vs mean
Переглядів 6762 місяці тому
For more videos in a logical order, go to: www.tilestats.com 1. Expected value vs mean 2. Weighted average vs the expected value (04:36) 3. Expected value of a discrete uniform distribution (06:35) 4. Expected value of a continuous uniform distribution (08:28)

Bootstrap confidence intervals - explained
Переглядів 8052 місяці тому
See all my videos at: www.tilestats.com/ 1. How to calculate a 95% bootstrap confidence interval (01:40) 2. Do bootstrap confidence intervals work? (05:00) 3. How to calculate a 95% bootstrap confidence interval for a difference in means between two samples (10:36) 4. How to calculate a 95% bootstrap confidence interval for parameters in a linear regression model (11:36)
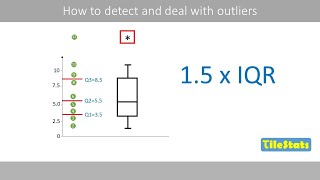
How to identify and deal with outliers | The 1.5 IQR rule | Boxplots
Переглядів 5433 місяці тому
See all my videos at: www.tilestats.com/ 1. How to calculate the IQR (0:26) 2. The boxplot (02:45) 3. The 1.5 IQR rule (04:00) 4. How to deal with outliers (05:00) 5. When a boxplot does not work (06:54)

Bayesian statistics - the basics
Переглядів 2,3 тис.4 місяці тому
www.tilestats.com/ 1. t-test vs Bayesian two-sample test (00:28) 2. Confidence interval vs credible interval (02:10) 3. Bayes' theorem (04:15) 4. The prior distribution (09:20) 5. How to compute the Posterior distribution with simulations (12:47) 6. How to calculate the credible interval (17:33) 7. Prior * Likelihood (19:37) 8. The highest density interval (HDI) (23:00) 9. How to compute the p-...

How to check normal distribution | The normality assumption
Переглядів 8975 місяців тому
See all my videos at: www.tilestats.com/ 1. Histogram 2. QQ plot (02:45) 3. Shapiro-Wilk (03:11) 4. An example of exponential distribution (08:40) 5. Type 1 and 2 errors in Shapiro-Wilk (10:49) 6. The normality assumption (14:49) 7. How to check the normality assumption (15:43)

PERMANOVA and permutation tests - explained
Переглядів 2,3 тис.6 місяців тому
www.tilestats.com/ 1. How to calculate the t-statistic 2. Permutation tests (02:40) 3. PERMANOVA (07:25)
Statistical power - Parametric vs Nonparametric test
Переглядів 1 тис.7 місяців тому
See all my videos at: www.tilestats.com/ In this video we will discuss the differences in statistical power and type 1 errors between the t-test and the Mann-Whitney U test (Wilcoxon Mann-Whitney (WMW), Wilcoxon rank-sum test) 1. Type 1 error - t-test vs WMW 2. Type 2 error - t-test vs WMW - normal distribution (04:30) 3. Type 2 error - t-test vs WMW - log-normal distribution (10:56) 4. R code ...
Meta-analysis | The inverse variance method | Forest plot in R
Переглядів 1,1 тис.7 місяців тому
www.tilestats.com/ 1. Meta-analysis - the basics 2. The inverse variance method (01:30) 3. How to interpret a forest plot (07:51) 4. Fixed vs random model (08:55) 5. How to create a forest plot in R (09:32)
The Mantel-Haenszel method - clearly explained | deal with confounding
Переглядів 3 тис.7 місяців тому
www.tilestats.com/ 1. The MH RR 2. The MH OR (06:52)
Understanding the odds ratio (OR) and the rare disease assumption | OR = RR?
Переглядів 7157 місяців тому
www.tilestats.com/ 1. A case-control study - example: smoking and lung cancer 2. How to calculate the OR (01:00) 3. How to interpret the OR (03:46) 4. How to calculate the 95% confidence interval of the OR (04:47) 5. OR = RR ? (06:25) 6. The rare disease assumption (08:18)
Relative risk - how to calculate and interpret | 95% CI
Переглядів 1,6 тис.8 місяців тому
www.tilestats.com/ 1. Smokers vs non-smokers - lung cancer 2. How to calculate the RR (01:10) 3. How to interpret the RR (02:40) 4. How to calculate the 95% confidence interval of the RR (04:00) 5. How to interpret 95% confidence intervals (06:20) 6. Interpret the RR in relation to the actual risk (08:10)
Odds vs Probability - explained
Переглядів 7708 місяців тому
www.tilestats.com/ 1. Understanding odds vs probability 2. Converting probability to odds (02:55) 3. Converting odds to probability (03:45) 4. Odds vs logged odds vs probability (04:00)
The SIR model | the math of epidemics - explained with a simple example
Переглядів 5188 місяців тому
The SIR model | the math of epidemics - explained with a simple example
Receptor ligand kinetics | mathematical modeling
Переглядів 5328 місяців тому
Receptor ligand kinetics | mathematical modeling
How to build a system of differential equations (ODEs)
Переглядів 6739 місяців тому
How to build a system of differential equations (ODEs)
How to select a multivariate analysis or machine learning method
Переглядів 3,2 тис.9 місяців тому
How to select a multivariate analysis or machine learning method
How to solve ordinary differential equations (ODEs) in R (deSolve)
Переглядів 1,6 тис.9 місяців тому
How to solve ordinary differential equations (ODEs) in R (deSolve)
Understanding ordinary differential equations (ODE) - super simple example
Переглядів 66010 місяців тому
Understanding ordinary differential equations (ODE) - super simple example
The Cox proportional hazards model explained
Переглядів 15 тис.11 місяців тому
The Cox proportional hazards model explained
Comparing Kaplan-Meier curves - the Log-rank test
Переглядів 3,3 тис.11 місяців тому
Comparing Kaplan-Meier curves - the Log-rank test
Nonlinear mixed effects models (NLME) - explained
Переглядів 5 тис.Рік тому
Nonlinear mixed effects models (NLME) - explained
Nonlinear regression - how to fit a logistic growth model to data
Переглядів 1,5 тис.Рік тому
Nonlinear regression - how to fit a logistic growth model to data
Nonlinear regression - how to fit a dose-response curve in R
Переглядів 3,2 тис.Рік тому
Nonlinear regression - how to fit a dose-response curve in R
Nonlinear regression - comparing models with F test and AIC | parameter correlation
Переглядів 1,8 тис.Рік тому
Nonlinear regression - comparing models with F test and AIC | parameter correlation
The Gauss Newton Method - explained with a simple example
Переглядів 9 тис.Рік тому
The Gauss Newton Method - explained with a simple example
But why call it poisson regression where the graph you used is clearly follows a exponential distribution?
Because the data points around the fitted curve follow a Poisson distribution.
Very nice explanation
This is so great. You're a good teacher, you explained what I have been trying to understand for more than a year in less than 30 minutes. You just got a new subscriber.
Please make about linear approximation method before applying Least squares method.
Your videos are great. You know that your video are one of learning materials for Statistics course in University of Groningen right? Much thanks
No i did not know that but it is great if it is useful.
Can you please provide the dataset on which you worked
The data set is the same as shown in the video.
Thank you for such a well explained video on Bootstrapping! Really impressive and clear!
Really easy to understand. Cause you explain the reason why. Where i can't get this from my teacher.
You are the best in my opinion. And I'm not bluffing
Amazing explanation. Thanks alot
What if the correlation coefficient equals to 1? In that case we would receive 0 in denominator under the square root sign. Overall, thanks a lot for this insightful course
True, then the t-stat will be infinity large.
@@tilestatsgiven we can't divide by 0, is it then replaced by some default infinitely small number?
this video is a gem .
Hi, you lost me for a moment at 5.42/13.11 where you calculated upper and lower CL - could you please layout further, how you achieved 43.37
Sorry revisited and got my answer- thx
Wow, this is awesome and very insightful I must subscribe to your channel
How are the 2.747 and 5.7 derived?
That is explained at 11:30 and forward.
Which software is used to get the equation for model Price = constant + Age.Coefficient + Mileage.Coefficient ?
You have to create the equation on your own and then use the software to estimate the parameter values for the equation. I use R but you can use any other statistical software to get the same parameter values.
Thank you for the detailed explanation! 1:12 May I know if both adjusting the significance level and adjusting p value result in the same conclusion, how do we decide which one to use? I see most of the papers use adjusted p value...
You will come to the same conclusion. In a paper, it might be confusing if you use different significance levels in different test. It is therefore easier if you use just one alpha (usually 0.05) and adjust the p-values.
@@tilestats Understood :) Thank you so much for your prompt reply. May I ask 2 questions? 1) Is the term "FDR adjusted p-value" interchangeable with "q-value"? 2) For RNA sequencing, I have significant DEGs when using p<0.05, but no significant DEGs when using adjusted p <0.05. Can I still use p value in order to get DEGs for downstream biological annotation?
FDR adjusted p-values usually refer to BH adjusted p-values or q-values. To see the difference, watch this video: ua-cam.com/video/T6J4b-WWebM/v-deo.html You can still use, for example, GSEA with a ranked gene list based on log2FC as I show in this video: ua-cam.com/video/EF94wPaqXM0/v-deo.html
Absolutely ❤❤❤❤
One of the Most underrated channels in UA-cam
Very well explained. Anyone can easily very well understand these concepts. Thanks!!!
What book can I find this in?
I have not used any book but you can buy most of the videos as PDFs on my home page: www.tilestats.com
@@tilestats I'm looking for bibliographic references on this topic but so far I haven't been able to find any. :(
6:57 I don't understand how we can now assume that the Groups have one random intercept. That would mean each group has their own distribution, which is not the case because as you said all 4 subjects are randomly sampled out of one distribution.
When we include Diet in the model, we can test if the two groups have different intercepts. Thus, we then no longer assume that all individuals are sampled from the same distribution.
@@tilestats thanks! I just realised the difference between groups and clusters. Now everything is clear!
Amazing! Thanks so much
At 11:00 how are the weights optimised, please?
Have a look at this video, where I explain how the weights are optimized: ua-cam.com/video/XxZ0BibMTjw/v-deo.html
@@tilestats Thank you so much, sir!
I did not understand why the cutoff od 0.001 would not be appropriate in cases when we have many datapoints. Could you clear this up for me?
Because, 0.1% of the data points will be outside the ellipse due to chance. If you for example have 1 million data points, you should expect that 1000 are outside the ellipse, right? It would then not be appropriate to define all these as outliers.
Very useful video, thank you
In my research, there are two groups: control and experimental. Both of these groups gave pre- and post-tests. Which test should I use? In the experimental group, there are 100 people,50 male, 50 female and in the control group, there are 100 people.50 male, 50 female, Could you please explain how to calculate the mean and standard deviation for this large sample? Thank you!”
You can use an unpaired t-test between exp group and control group based on the differences between pre and post test.
@@tilestats thanku so much, If my population is larger, do I still need to use a paired t-test over a z-test?
Z-test is generally only used if you know the population variance (which is usually not the case). For a large sample size, the Z-test and t-test will result in about the same p-value.
@@tilestats thanku so much.
Here , 'Binom(6,8,p)' is this a likelihood or conditional distribution of x given parameter? [ f(x | p) ] I think both are same 🙂 or I don't know.
It is the likelihood. When you are trying to estimate the parameter p based on observed data (6 successes out of 8 trials), you are using it as a likelihood function. You may watch this video to get a better understanding: ua-cam.com/video/PRpmA6WsY6g/v-deo.html
Such good explanation for the beginner like me
thank you! if i want to calculate a confidence interval at other confidence levels, for example 98%?
Then you just use 98% instead of 95% in this video.
nice video! how do you do the log-rank test when you have several groups? in my particular case i have 13 groups. what can i do to reduce the family wise error rate?
If you want to do many pairwise comparisons, you can adjust your p-values by, for example, Bonferroni: ua-cam.com/video/4_V2m41vpZw/v-deo.html or Holm's test: studio.ua-cam.com/users/videol4yVt_Dht4U/edit
by far one of the best, to not say the best explained on this subject (without exaggerating)
Your videos give the best explanations! You make it so clear and easy to follow. Thank you!
why using 2 output nodes? isn't P(healthy) equal to 1-P(cancer)?
True, you can use just one output node when you predict just two categories. The R code I provided generates two output nodes but if you try TensorFlow in Python, it will use just one output if you set loss='binary_crossentropy'.
@@tilestats Thanks for the clarification
Thank you so much, this is really helpful I finally understand now 24hr before my final
I see that you centered the data. Is only centering required for "standardization" or scaling is also normally done such that the mean =0; standard deviation=1? this will then change the covariance matrix since variance of individual dimensions will equal 1.
It is not a requirement, mathematically, to standardize your data (mu = 0, SD = 1), but it is highly recommended, especially if you have variables with a large difference in the variance. I discuss that in the next video about PCA: ua-cam.com/video/dh8aTKXPKlU/v-deo.html
excellently explained
Inquiry: If I had one group of males and females, and I applied treatment to them and took three measurements If the conditions for a t-test are present, use a two-sample t-test to test the treatment difference between males and females in each measurement Secondly, it is possible to use a repeated-measures test to compare the effect of treatment on males in repeated measurements I repeat this again for females
You could do that but a better alternative is to used a mixed two-way ANOVA: ua-cam.com/video/9yIobRrZAyg/v-deo.html ua-cam.com/video/NKMFgejt3U0/v-deo.html so that you also can check if there is an interaction.
@@tilestats how can i check if there is an interaction
the best explanations for regression and neural networks to a non-expert statistician. thanks for posting
Woahhhh❤❤❤❤
This was extremely helpful, thank you so much
Great ,thanks a lot.
can you do ridge regression in detail sir?i am not able understand its intuition and maths behind it on online videos..
Here I explain Lasso and later Ridge ua-cam.com/video/bPFjfZWWQO0/v-deo.htmlsi=Nv8SiRp5jCHnhYE0
Thanks for your work.
you're a life saver! I've been trying to understand this for daysssss and this is the only video that nailed it! Thank you so muchhh
tremendous lecture. Thank you so much
Is anybody having step by step notes for this sum.. Pls reply
Quantile regression next, please!
hello ur video so interesting, can i ask a code for CA in boundary conditions please?
Have you seen this video ? ua-cam.com/video/6byzbkDe-RI/v-deo.html
Amazingly simplified explanation 👌